
Build grouped reports whose totals can be traced back to source records.
Choose the Report’s Grain
Grist’s summary documentation describes group-by fields and formulas over each group’s underlying records. One row in a summary therefore represents a group, rather than an individual source record. Keep that distinction clear when presenting numbers to a colleague.
For a hypothetical project report, grouping by Status answers “how much work is in each state?” Grouping by Owner and Status answers a different question about responsibility. Adding fields can split the same workload into many more groups without changing the underlying projects.
Documentation: Grist: Summary Tables
Choose an Aggregation That Matches the Question
Summing hours makes sense when hours represent additive work. Summing hourly rates generally does not answer a useful staffing question. The official guide shows how summary formulas can use sums, averages and other calculations.
Suppose one project has two hours and another has eight. Their mean is five, while their sum is ten. A separate hypothetical team has one project with ten hours. Taking the mean of the two team means gives 7.5; averaging all three projects gives about 6.67. Those are arithmetic examples showing why averages need a defined denominator.
Documentation: Grist: Summary Tables
Build the Smallest Useful Report
Start with one group field and one measure. Add another dimension only when it helps the stated decision. Keep a clear title such as “Estimated hours by current status” so readers do not mistake planned work for completed work.
- Record the included source table and the meaning of one source row.
- Inspect blank, inconsistent and retired category values.
- Create the summary with the intended group fields.
- Check the measure’s formula and unit.
- Compare its total with an independently calculated source total.
- Drill into at least one group and reconcile its member records.
Documentation: Grist: Summary Tables
Investigate Unexpected Groups
An unexpected “Open ” category may differ from “Open” because of the underlying data, not the reporting design. Check the raw values and decide how to normalize them. Preserve an audit trail if categorization changes affect prior reporting.
A total can also change because source records changed after the baseline was recorded. Capture the reporting time and population together. If the report is intended as a month-end statement, define whether later corrections should update it or require a separate historical snapshot.
Hypothetical project-hours reconciliation
This is an illustrative worksheet to adapt to your own evaluation. It is not a measured product test or a claim about results in your installation.
| Status | Source Hours | Expected Group Total |
|---|---|---|
| Open | 2 + 8 | 10 |
| Complete | 3 + 5 | 8 |
| Unassigned status | 1 | 1, visibly separated |
| All statuses | 2 + 8 + 3 + 5 + 1 | 19 |
A summary is ready to use when its grouping, units and denominator are explicit and its total reconciles with its source.
Inspect the official interface evidence
These previously captured interfaces provide orientation. Their versions and dates are distinct from the documentation review above.
Inspect the interface, with its context.
Open a specimen to see the source image and the observations it supports. A vendor demonstration is distinct from a self-hosted installation.
GristOfficial public demo · Demo identifies v1.7.20
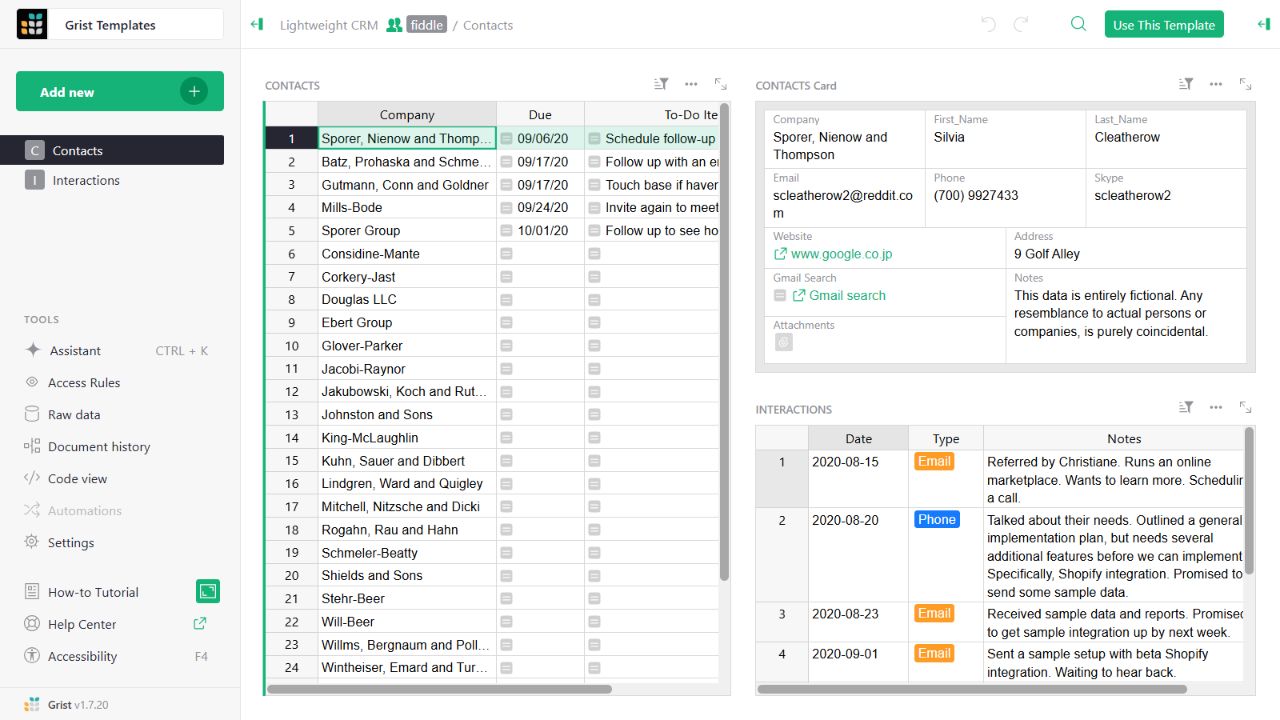
- Contact gridThe left widget lists sample companies and follow-up tasks.
- Detail cardThe upper-right widget presents fields for the selected contact.
- Related interactionsThe lower-right widget displays the sample interaction history.
Check the facts and their boundaries.
Official documentation supports the product statements. The evaluation procedures and synthetic examples are editorial guidance. We have not independently run the installation, migration or recovery procedures described here.
Group-by tables and aggregation formulas. Reviewed 2026-11-01.